
Assess Status of Species
Type of resources
Topics
Keywords
Contact for the resource
Provided by
Years
Formats
Representation types
Update frequencies
status
-
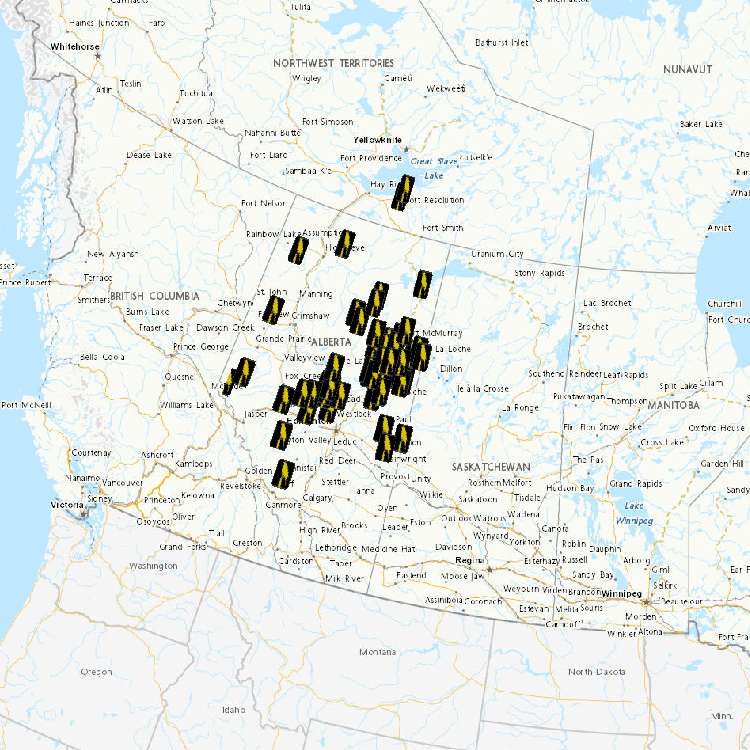
This collection houses PDFs of active BBS route maps, which are grouped by province or territory. These maps allow BBS volunteers in Canada to easily locate the start of their route, and to navigate the official route. The BBS is jointly coordinated by Environment Canada's Canadian Wildlife Service and the U.S. Geological Survey (USGS), Patuxent Wildlife Research Center. Any use of BBS data for Canada should acknowledge the hundreds of skilled volunteers in Canada who have participated in the BBS over the years, those who have served as provincial or territorial coordinators for the BBS, and the Boreal Avian Modelling Project (BAM; www.borealbirds.ca), whose collaboration was invaluable to the creation of the BBS route and stop location dataset.
-
The North American Breeding Bird Survey (BBS) is a road-based, long-term, continental survey that focuses on measuring breeding bird abundance at 50 stops along roughly 40-km long transects. This collection houses PDFs of active BBS route maps, which are grouped by province or territory. These maps allow BBS volunteers in Canada to easily locate the start of their route, and to navigate the official route. Once available, the collection will also house the GIS shapefiles for all active and discontinued route paths in Canada, and the current locations for all 50 stops along each transect. This collection also houses archived trend results and annual indices derived from analyses prepared by the Canadian Wildlife Service using BBS data for 2009, 2011 and 2012. A link for the most current BBS trend results is provided below under Supplemental Information. Raw BBS data are publicly available through through the USGS Patuxent Wildlife Research Center's website, at the link provided below under Supplemental Information. The BBS is jointly coordinated by Environment Canada's Canadian Wildlife Service and the U.S. Geological Survey (USGS), Patuxent Wildlife Research Center. Any use of BBS data for Canada should acknowledge the hundreds of skilled volunteers in Canada who have participated in the BBS over the years, those who have served as provincial or territorial coordinators for the BBS, and the Boreal Avian Modelling Project (BAM; www.borealbirds.ca), whose collaboration was invaluable to the creation of the BBS route and stop location dataset.
-
Sidney Island Shorebirds Survey peep counts.
-
The Point Lepreau Bird Observatory (PLBO), located in Point Lepreau, New Brunswick, was created as a project of the Saint John Naturalists’ Club (SJNC) in late 1995. The SJNC began accumulating data on bird migration through the Bay of Fundy in spring and fall in 1996. Migration data are collected daily using a sampling method with protocols adapted from Hussell and Ralph (1998). Migration counts using the Hussell and Ralph (1998) count protocol involve a four-hour Count Period consisting of a series of 15-minute counts, each followed by a rest period of equal length. Each Count Period consists of eight 15-minute counts, for a total of two hours, and eight 15-minute periods of rest. Observations are conducted from a permanent observatory building from mid-March to mid-May and from mid-September to mid-November. Observers count all birds seen and since Point Lepreau projects southward into the Bay, birds in spring migration are travelling east when passing it while birds in fall are travelling west. Since the year 2000, counts in spring have been under the supervision of a contracted Official Observer, normally assisted by up to three volunteers. The data are split in to a conditions file and an observations file. The conditions data includes information on weather conditions, sea states and times and durations of each count. The observations data includes observations of birds by species, including numbers of individuals observed and direction of flight. Birds travelling in different directions are recorded separately as are birds resting or feeding on the water.
-
The surveys are conducted along the sandspit and within a 96 ha lagoon that encompasses mudflats, eelgrass beds, and saltmarsh at the northwest end of Sidney Island, located in the Strait of Georgia, British Columbia. The survey counts numerate two species, Western Sandpiper (Calidris mauri) and Least Sandpiper (Calidris minutilla), during a portion of the southern migration period (July, August, and early September), and have been conducted intermittently since 1990. Sidney Island (48°37’39’N, 123°19’30”W) is located within the Salish Sea (Strait of Georgia), 4 km off the coast of Vancouver Island in southwestern British Columbia, Canada. Southbound Western and Least Sandpipers stop over within Sidney Spit Marine Park (part of the Gulf Islands National Park Reserve), roosting and feeding along the sandspit and within a 96 ha lagoon that encompasses mudflats, eelgrass beds, and saltmarsh at the northwest end of the island. These species are the most numerous shorebird species using the area during southern migration. Adults precede juveniles, arriving at the end of June and throughout July. Juveniles reach the site in early August, with their numbers trailing off in early September. As a result, the site experiences a transition from purely adult to purely juvenile flocks over the course of the season. Daily counts, beginning in early July and ending in early September, were conducted in 1990 and from 1992-2001 (no counts occurred in 1991). Effort was reduced to weekly surveys between 2002 and 2013. Over the entire monitoring period median survey effort was 9 counts annually. All counts were conducted at the low tide of the day, when shorebirds were feeding in the exposed mudflat of the lagoon. Observers walked along the shore of the lagoon stopping periodically at vantage points to look for birds. For ease of data recording and to keep track of individual flocks, the survey area was divided into separate units demarcated by prominent geographical features. Counts were made with the unaided eye, through binoculars, and with a 20 – 60x zoom spotting scope, depending on the proximity of the birds. All individuals in small flocks were counted and individuals in large flocks were estimated by counting in groups of 5, 10, 50 or 100 according to flock size in each successive field of view across a scan of the entire flock. Between 1990 and 2001, when daily counts were conducted, birds were occasionally counted more than once in a day. The largest count value obtained was used as the daily estimate for these days. For smaller flocks, we were able to identify all individual birds to species and age-class. Sub-samples from larger flocks were also aged (adult or juvenile) and identified to species. Birds were aged by plumage characteristics. Adult Western Sandpipers are distinguished from juveniles by the dark chevron markings present along the sides and breast. Juvenile Least Sandpipers have a buffy breast compared to the distinct, darker one of the adult, and juveniles have bright rufous scapulars compared to the drab feather-edges of the adults. In both species, juvenile plumage appears brighter and cleaner than adult plumage, which is more worn and tattered.
-
Waterfowl and mammals harvested and trapped at various locations in the oil sands region and in reference locations are assessed for contaminant burdens and toxicology. Wildlife samples are obtained from local hunters and trappers. Tissue samples are analysed for concentrations of oil sands-related contaminants (heavy metals, polycyclic aromatic hydrocarbons, and naphthenic acids). Dead and moribund birds collected from tailing ponds are also evaluated for levels and effects of contaminants.
-
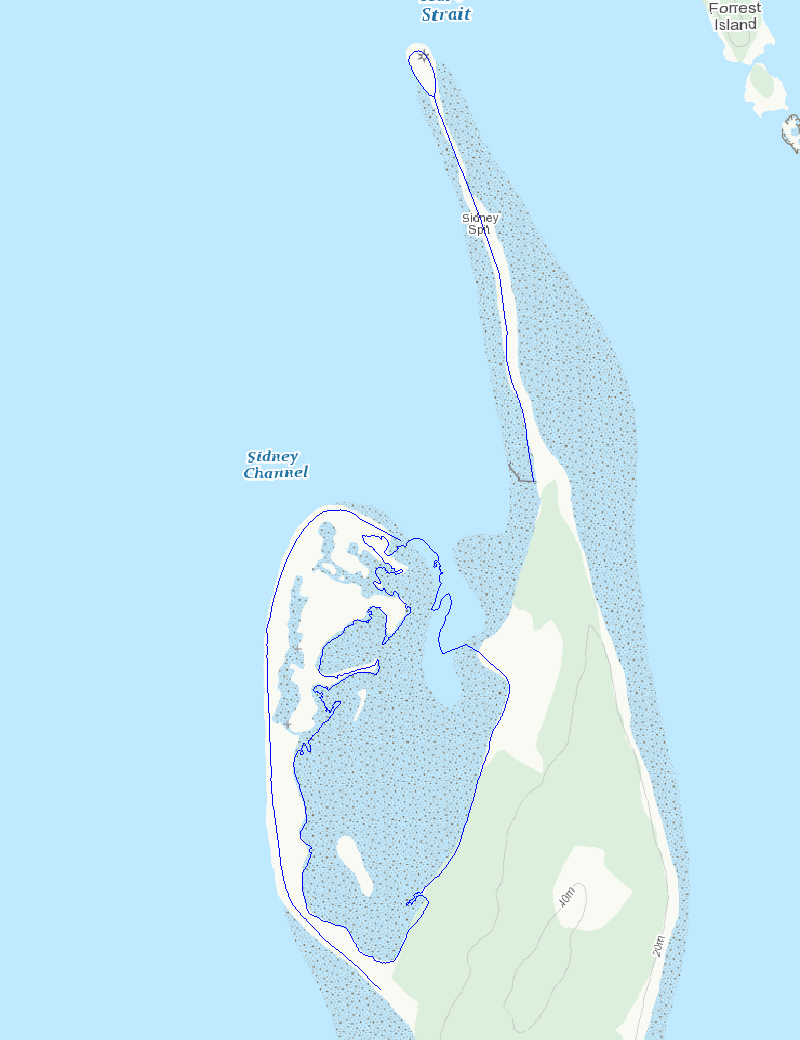
Sidney Island Shorebirds Survey transects line feature.
-
The Canadian Breeding Bird Census (BBC) Database contains data for 928 breeding bird plot censuses representing all known censuses of breeding birds carried out in Canada during the period 1929–1993. The 928 records in the database represent 640 unique census plots located in all provinces and territories, except Prince Edward Island. The BBC, which was replaced by the current Breeding Bird Survey, is one of the longest-running surveys of bird populations in North America, and was designed to help determine abundance and distribution patterns of bird species. An important feature of the BBC Database is the habitat data associated with each census plot. The most prevalent vegetation species in different layers (canopy, shrub and ground cover) were recorded to reflect the assumption that birds respond principally to vegetative structure.
-
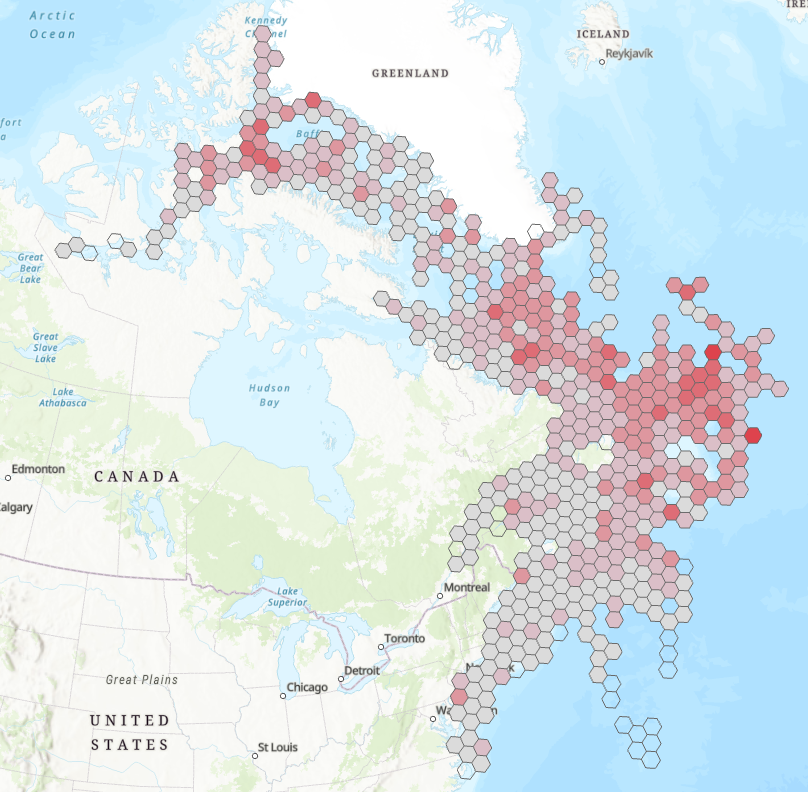
The atlas provides printable maps, Web Services and downloadable data files representing seabirds at-sea densities in eastern Canada. The information provided on the open data web site can be used to identify areas where seabirds at sea are found in eastern Canada. However, low survey effort or high variation in some areas introduces uncertainty in the density estimates provided. The data and maps found on the open data web site should therefore be interpreted with an understanding of this uncertainty. Data were collected using ships of opportunity surveys and therefore spatial and seasonal coverage varies considerably. Densities are computed using distance sampling to adjust for variation in detection rates among observers and survey conditions. Depending on conditions, seabirds can be difficult to identify to species level. Therefore, densities at higher taxonomic levels are provided. more details in the document: Atlas_SeabirdsAtSea-OiseauxMarinsEnMer.pdf. By clicking on "View on Map" you will visualize a example of the density measured for all species combined from April to July - 2006-2020. ESRI REST or WMS map services can be added to your web maps or opened directly in your desktop mapping applications. These are alternatives to downloading and provide densities for all taxonomical groups and species as well as survey effort.
-
The Atlas of Pelagic Seabirds off the West Coast of Canada presents maps that display the distribution of 48 species of seabirds and two species pairs (i.e., Red-necked and Red Phalaropes, and Hawaiian and Galapagos Petrels). Seabird surveys were conducted aboard commercial and Canadian federal government ‘ships-of-opportunity’ from 1982-1983 and 1991-2005 within the study area (45° N to 58° N and from the coast to 148° W). Sightings of rare species that came from other sources (including some pre 1982 and post 2005) are also included in order to present as complete a picture as possible. For 33 species and one species pair, the average densities within 5’ latitude by 5’ longitude grid cells are displayed seasonally. The seabirds mapped in this manner include 11 species of Procellariiformes (albatrosses, fulmars, petrels, shearwaters and storm-petrels), and 24 species of Charadriiformes (phalaropes, skuas, gulls, terns and auks). The sighting locations for an additional 15 species and one species pair are also mapped. This group, comprised of 10 species of Procellariiformes and seven species of Charadriiformes includes species that are relatively uncommon to rare in the study area (but previously documented); and species that are extremely rare and/or have not been documented and thus remain unconfirmed. These data may be used to generate presence/absence and trends in and estimates of relative abundance. These data can also be used to examine patterns in temporal and spatial distribution. However, due to the opportunistic nature of the surveys, both in space and time, these data should not be used to determine absolute abundance. The rationale for developing this atlas was the recognized need for a product that could assist with: coastal zone and conservation area planning; emergency response to environmental emergencies; and identification of areas of potential interactions between seabirds and anthropogenic activities. In addition, the data used to develop the document provides a baseline to compare with future seabird distributions in order to measure the impacts of shifts in composition, abundance and/or distribution of prey, and climatic and oceanographic changes.